Case Study — Creative Code
Quake Globe
Live USGS seismic data rendered as magnitude-scaled spikes on a Three.js globe — with a time scrubber, a true-depth view that exposes subduction zones, and a render pipeline tuned down to six draw calls.
Live USGS seismic data rendered as magnitude-scaled spikes on a Three.js globe — with a time scrubber, a true-depth view that exposes subduction zones, and a render pipeline tuned down to six draw calls.
The USGS publishes earthquake activity continuously as GeoJSON — coordinates, magnitude, depth, timestamp. It's complete, it's free, and it's close to unreadable. Quake Globe turns that feed into a planet you can rotate, replay, and read at a glance.
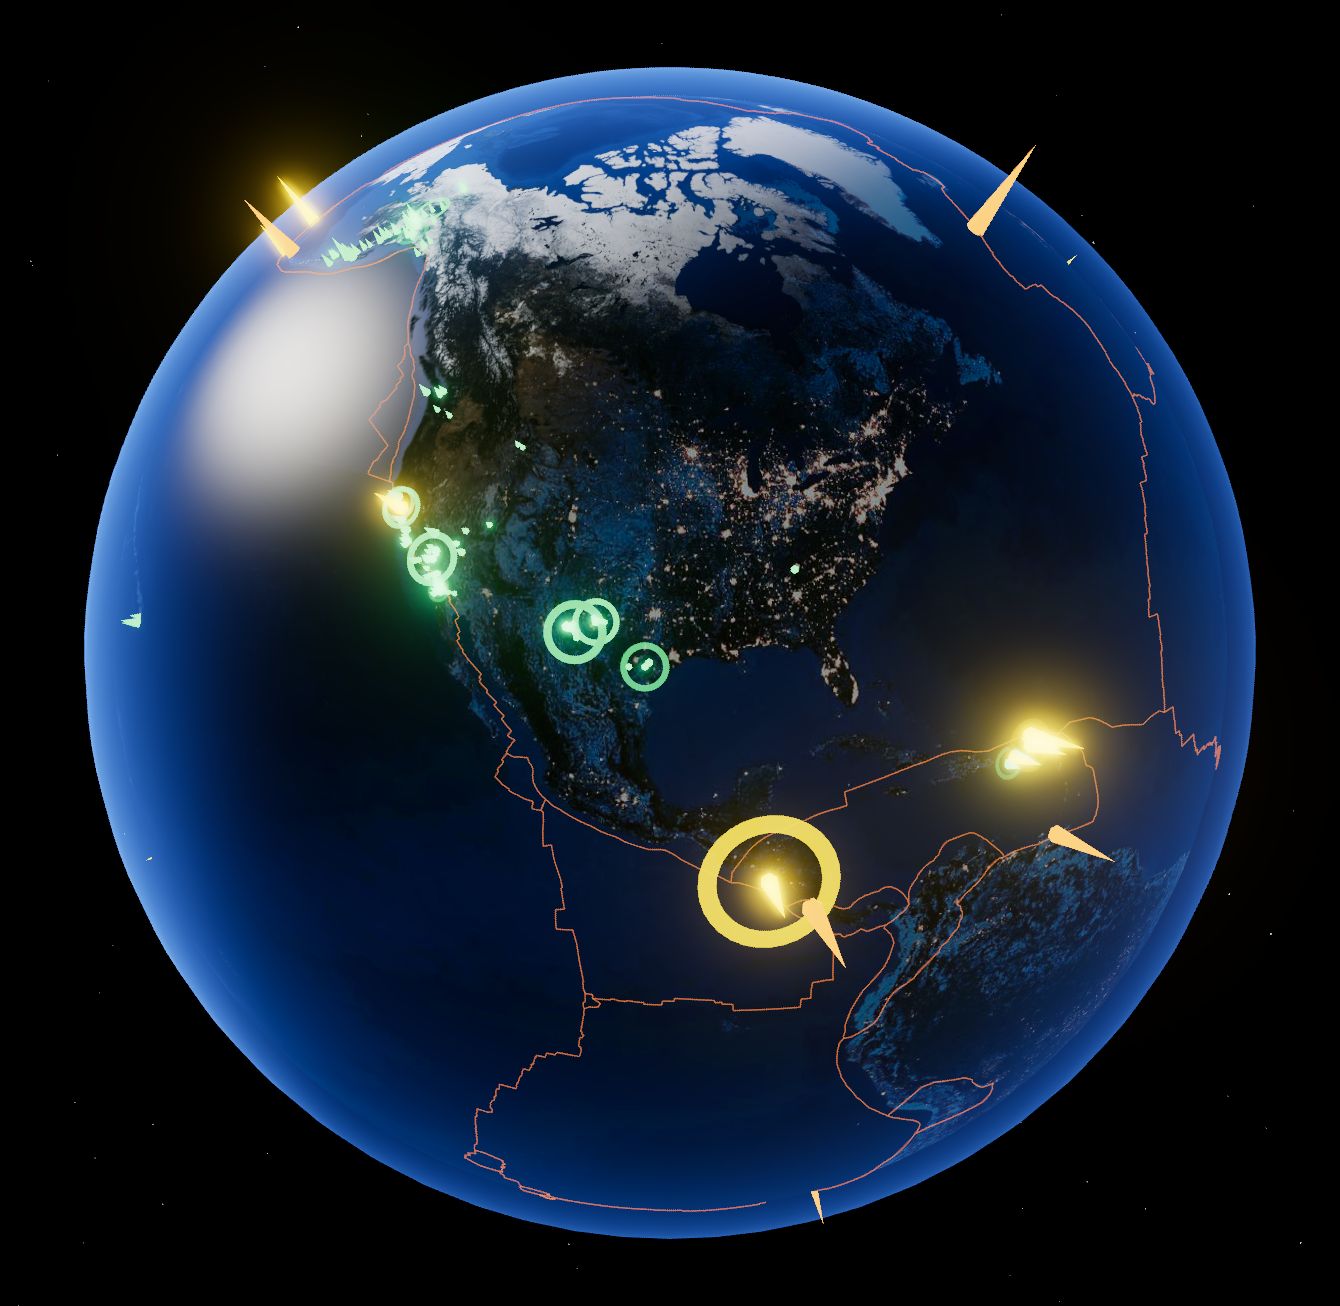
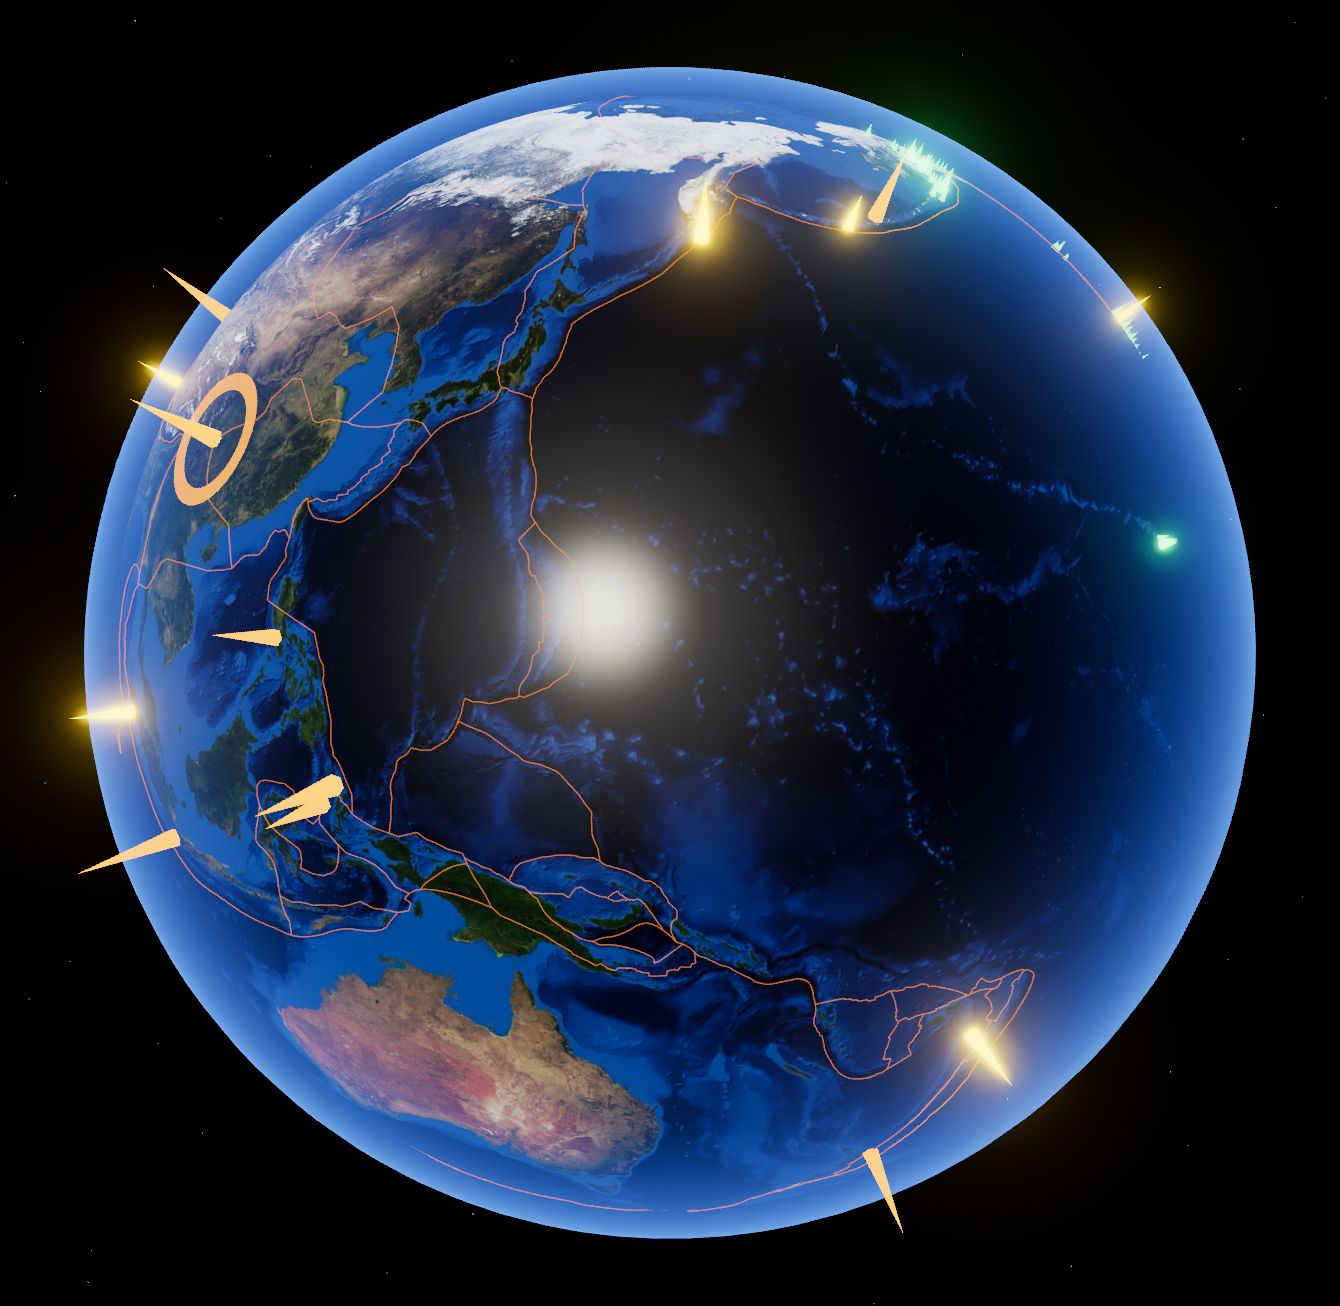
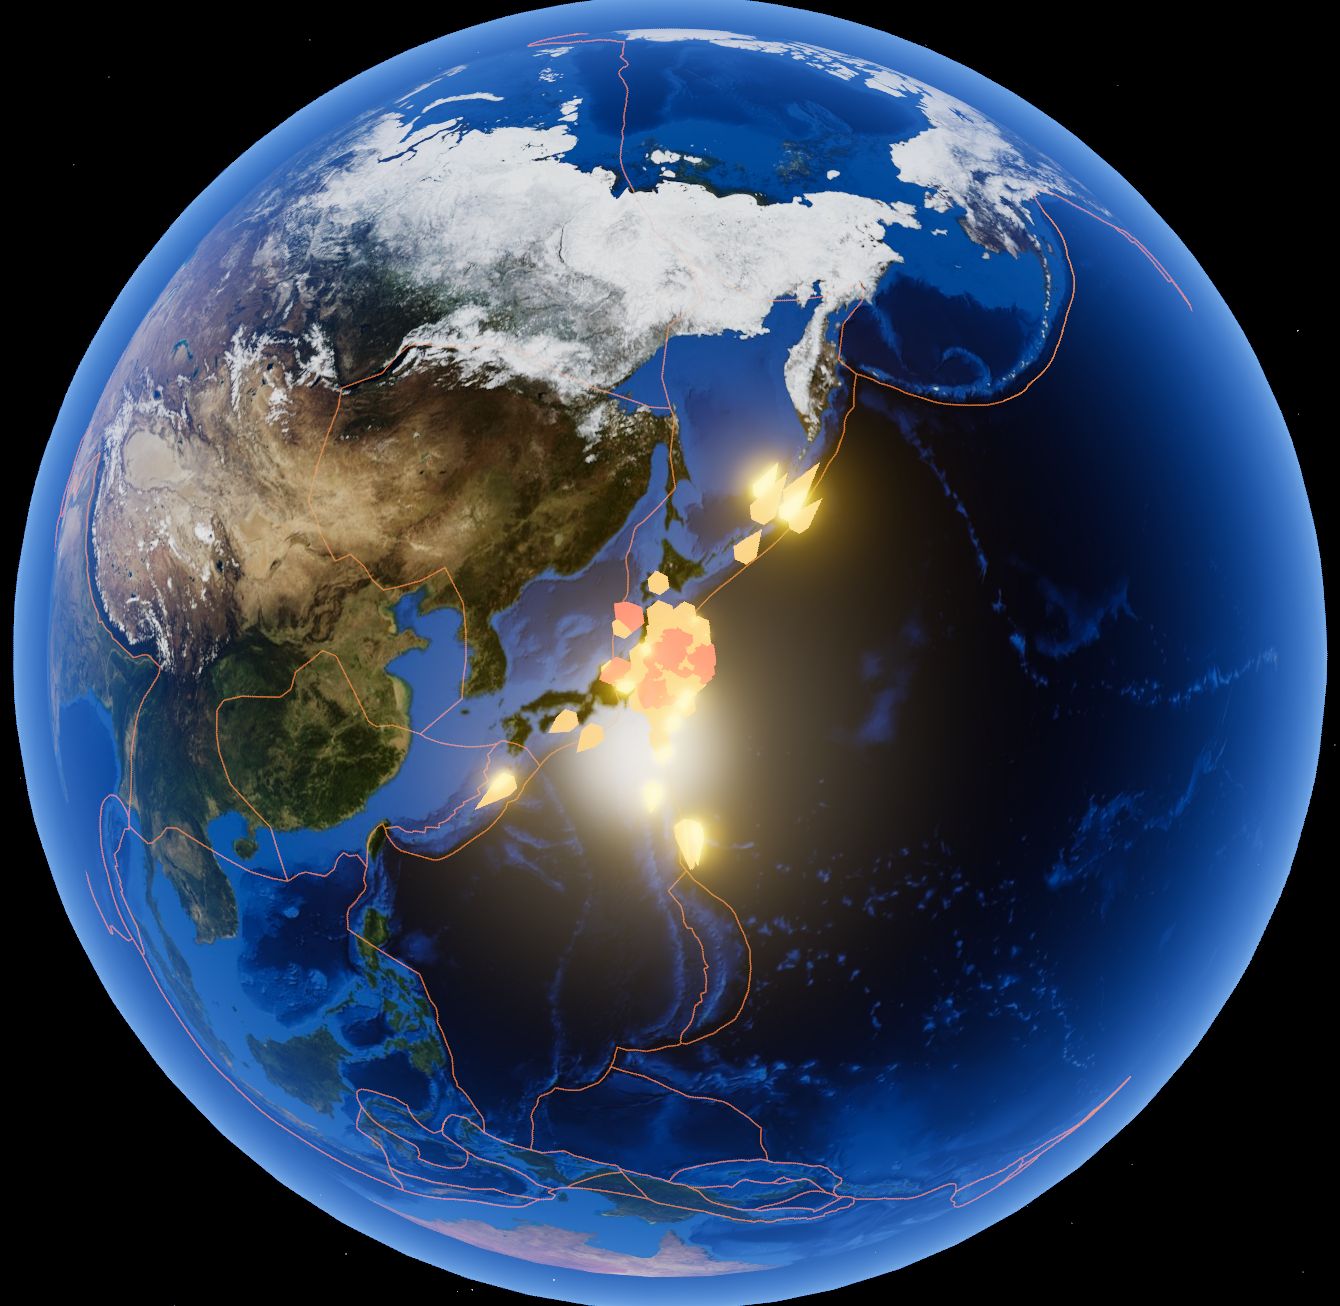
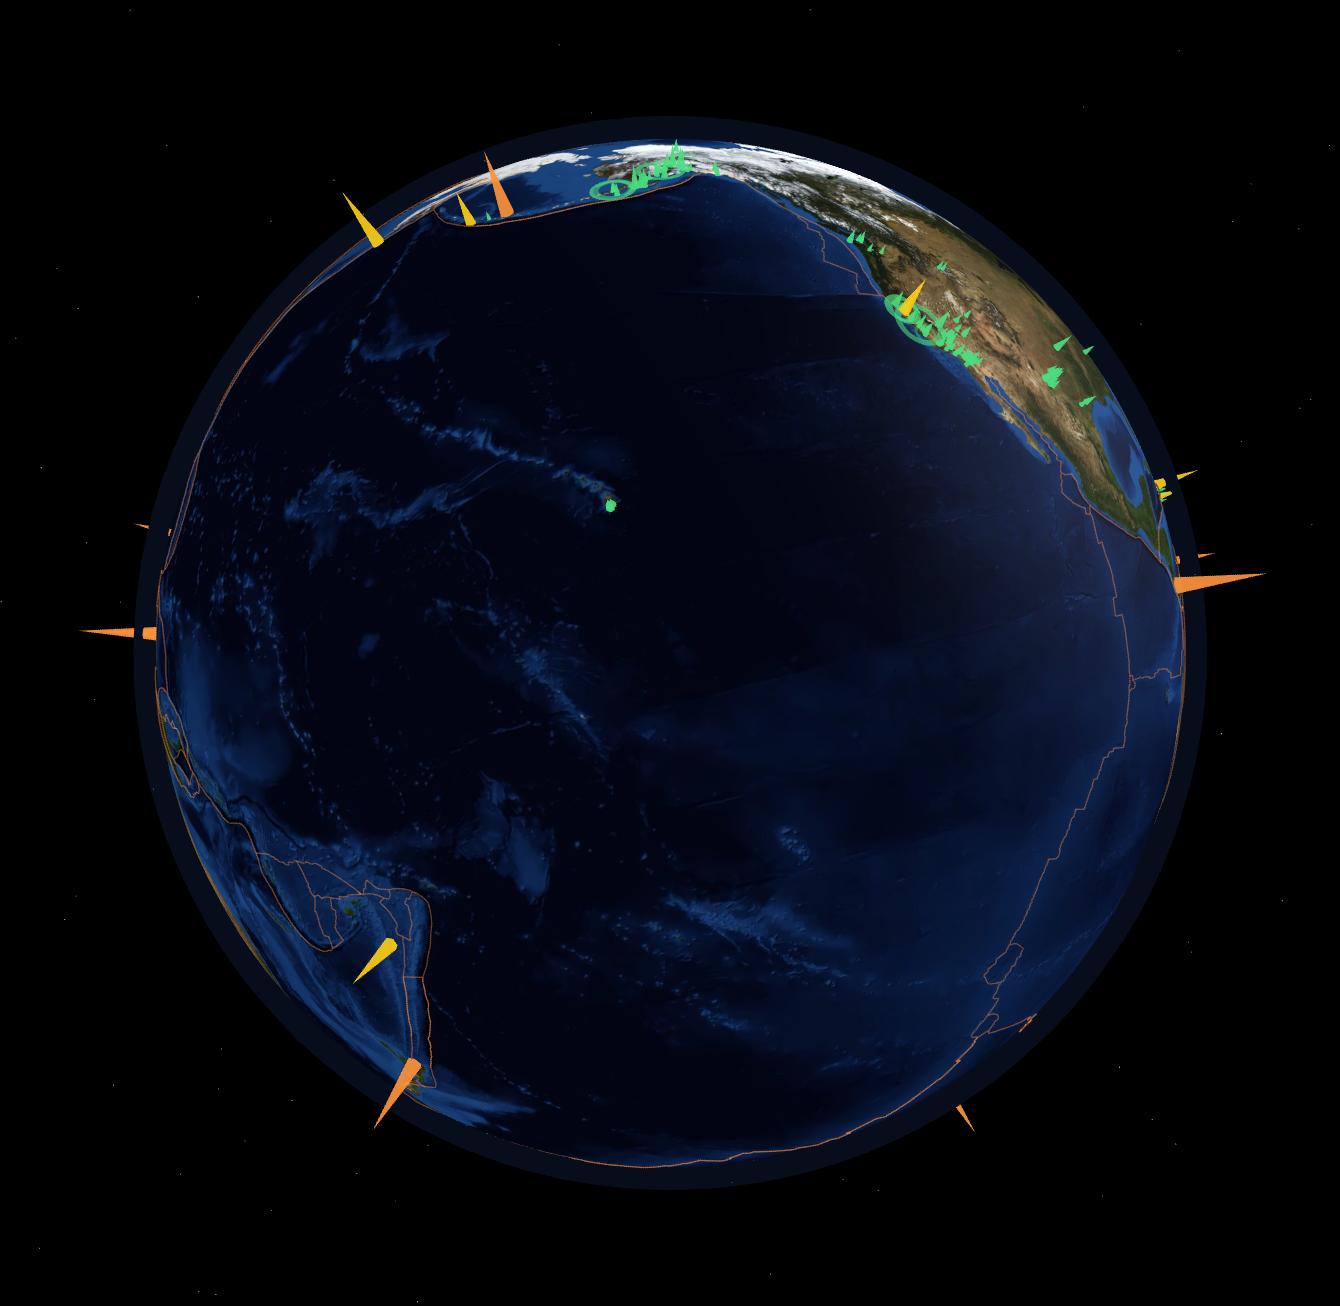
Every event becomes a spike on a rendered Earth, coloured and scaled by magnitude. A day/night terminator computed from the live subsolar position means the globe matches the one outside your window — city lights on the dark half, sun glint on daylit ocean.
Quakes originate anywhere from the surface to roughly 700 km down. A pin map flattens a subduction slab into a smear of dots and discards the geometry that explains it.
Aftershock cascades and building swarms are stories told over hours and days. A single frame shows the aftermath and none of the plot.
Asking "what happened off Japan in March 2011?" normally means hand-building fdsnws archive requests — a hard stop for anyone who isn't already technical.
The all_month feed carries about 10,600 events. Rendered naively — one mesh per quake, a raycast across every instance per hover — the page stutters before it's useful.
Depth view turns the globe into a translucent wireframe and re-renders every quake at its true (exaggerated) depth, recoloured along a five-stop ramp. What reads as an unreadable cluster of dots on the surface resolves into the dipping plane of a subducting plate. Tonga–Fiji is the clearest example on Earth, and it renders in a single instanced draw.
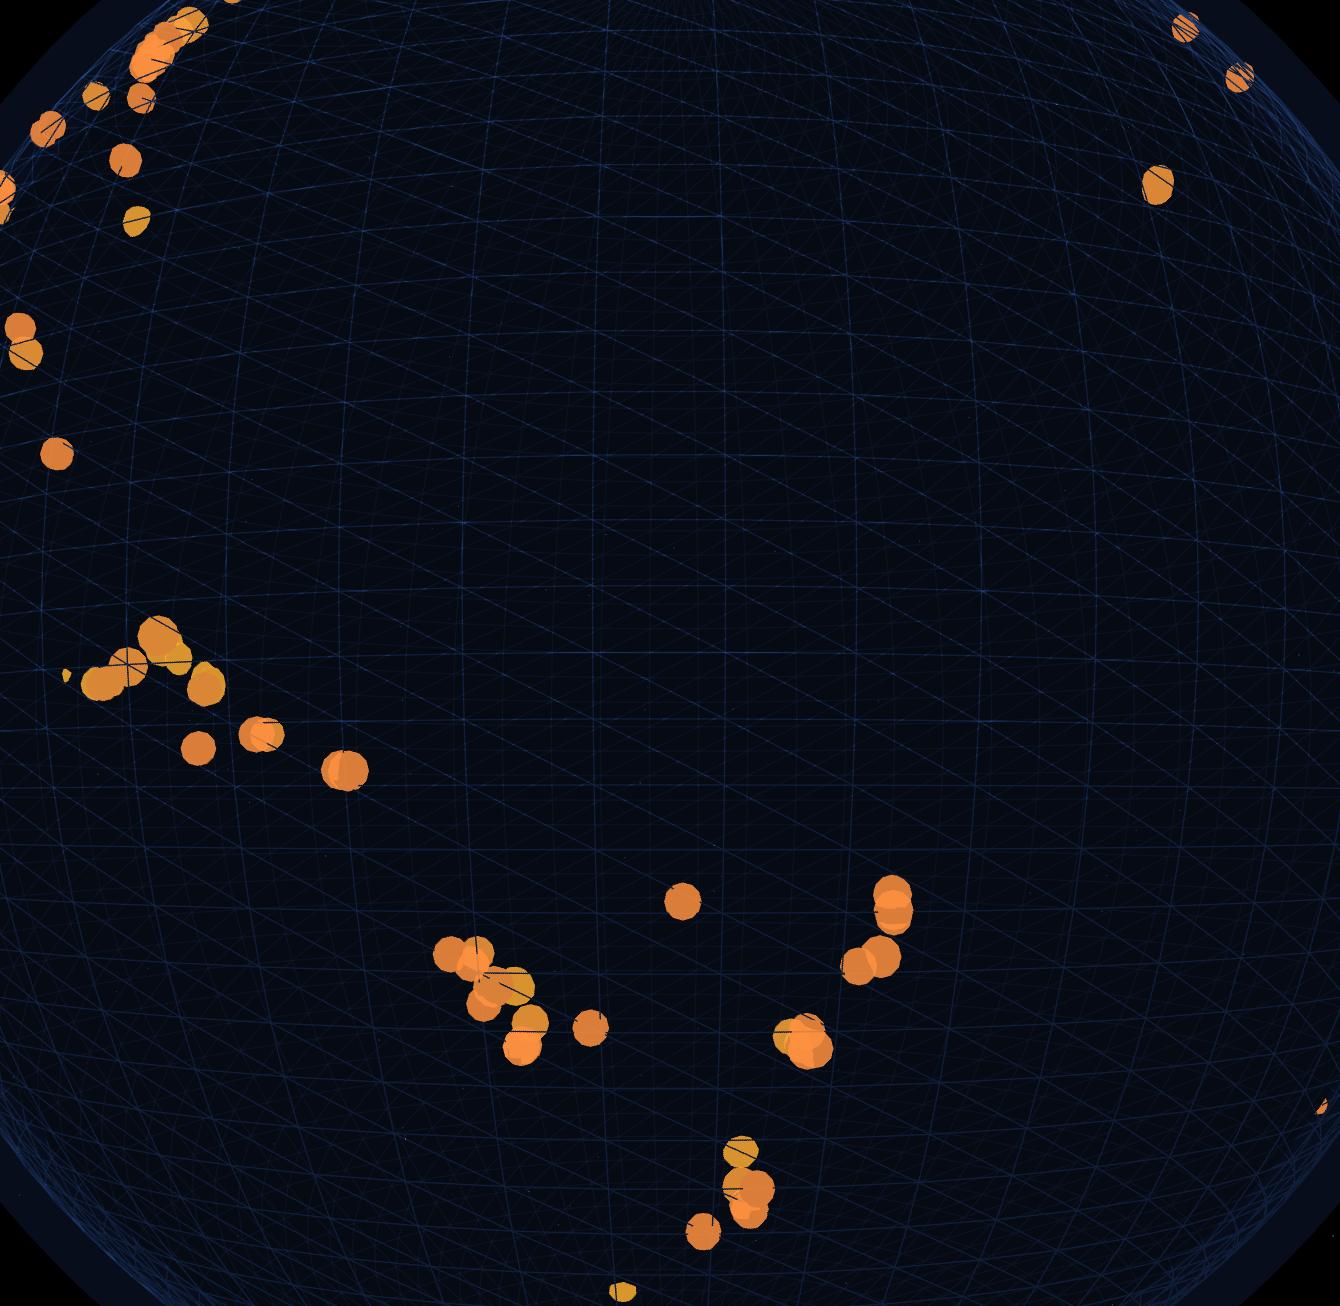
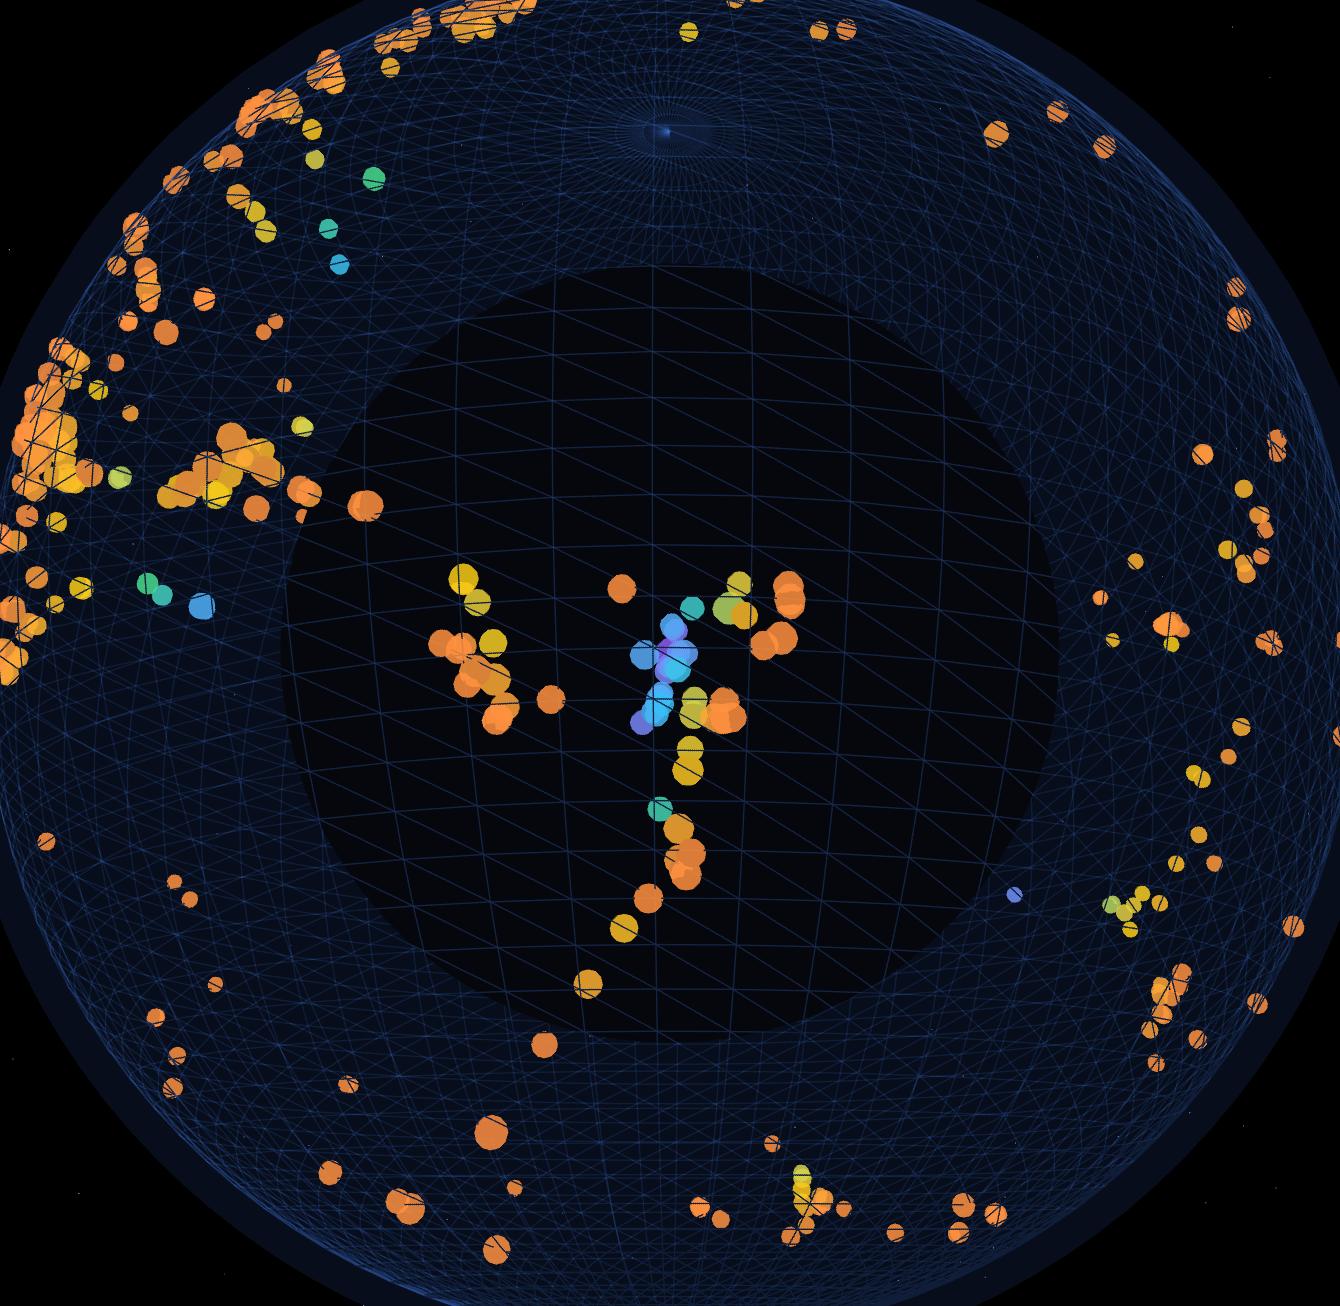
Magnitude drives hue and spike height together, so severity reads before you've focused. Switch to depth view and the same markers re-map onto a separate ramp — warm at the surface, violet at the bottom of the slab.
Play the loaded range chronologically. Quakes flash bright as they occur, then settle — turning a static cluster into a visible sequence.
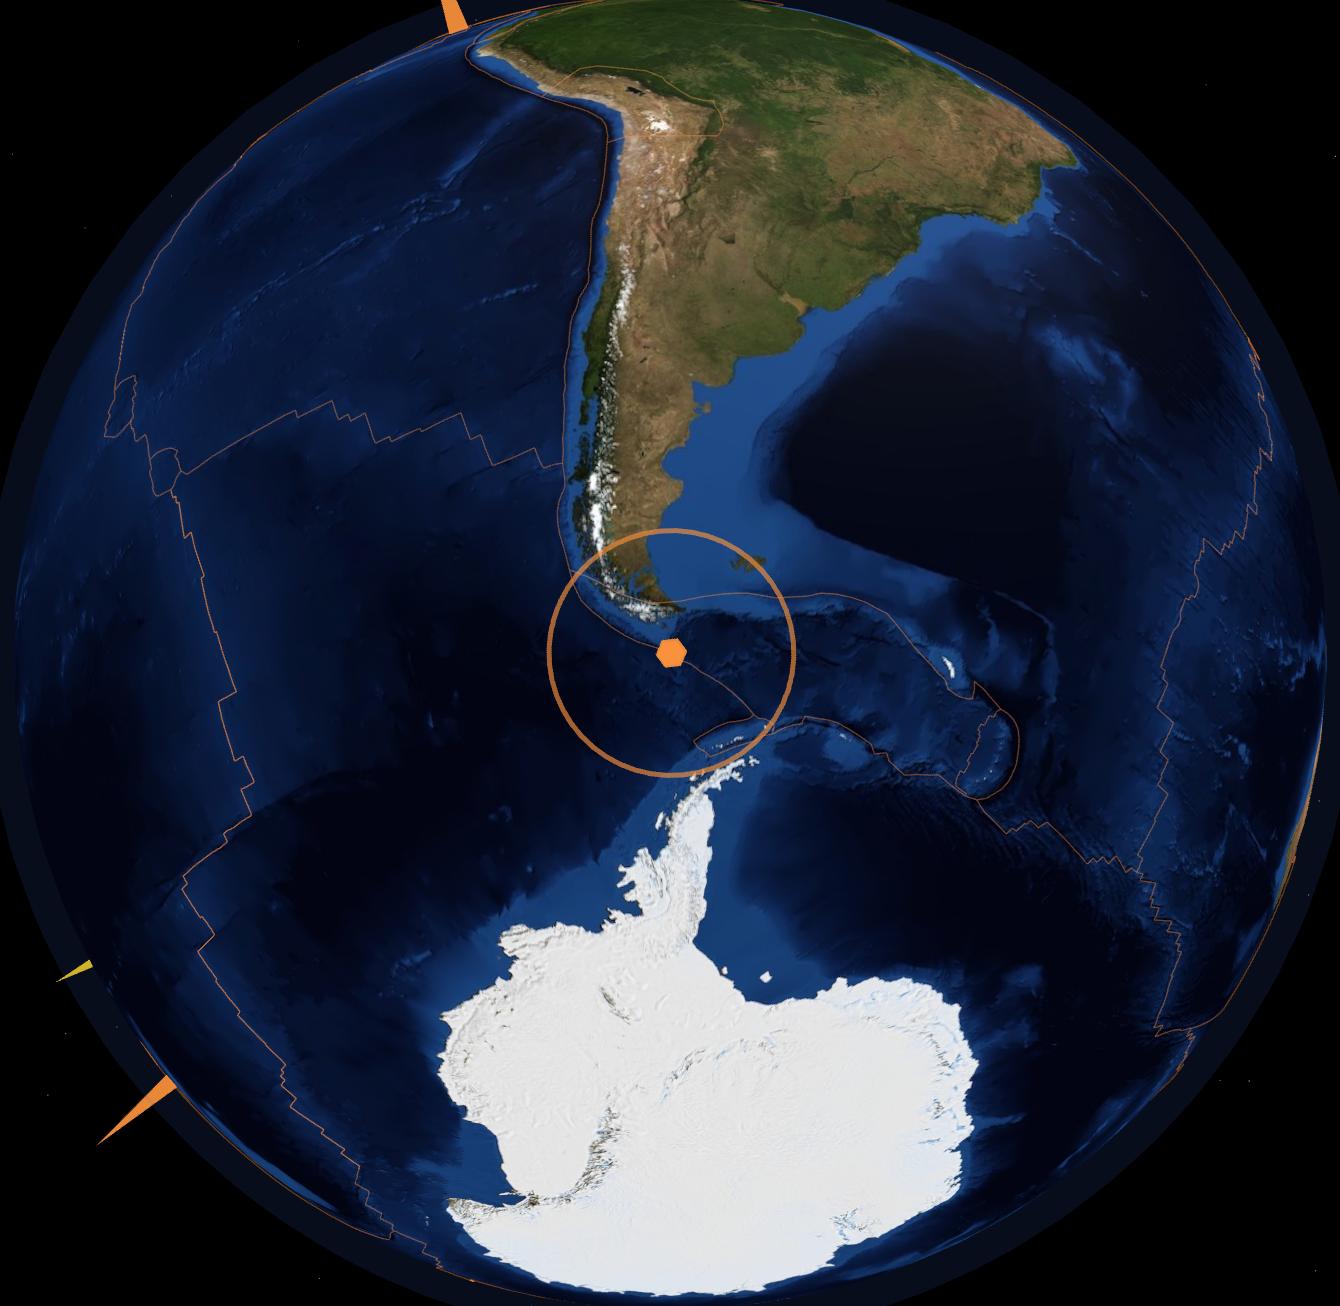
Any date range via the USGS fdsnws archive, with a magnitude floor and region presets for Japan, Chile, Alaska and more.
Refetches every five minutes and diffs by event id. New arrivals get an expanding shockwave, a toast, and an optional audio ping.
Peter Bird's PB2002 dataset bundled at build time and drawn as a single LineSegments call — the reason the clusters sit where they do.
Query, filters, camera and selected event all live in the URL hash, so whatever you're looking at is one paste away from someone else's screen.
Magnitude histogram, quakes over time, and depth distribution — no charting library, no added bundle weight.
The visual design was half the work. A dedicated optimization pass rebuilt the hot paths: the feed moved to a worker producing transferable typed arrays, picking gained a bounding-sphere broad phase in front of a BVH, and rings, shockwaves and stars each collapsed into one instanced draw with the animation moved into the vertex shader.
| Metric | Before | After | Change |
|---|---|---|---|
| Draw calls (scene) | 47 | 6 | 8× |
| CPU frame submit | 0.40 ms | 0.04 ms | 10× |
| Pick raycast, 10.6k instances | 0.78 ms | 0.09 ms | ~9× |
| Main-thread long tasks on load | 67 ms | none | worker |
| Allocation rate, idle rotate | 9,950 KB/s | 1,449 KB/s | ~7× |
| Texture payload | 2,546 KB | 586 KB | 4× |
| Lighthouse performance | 75 | 84 | TBT −54% |
Two of those results came with a constraint attached. Bloom is applied without a second render pass — the scene renders into a half-float HDR target and only marker colours are pushed past the threshold, so the markers glow and the Earth never does. And the KTX2 compressed textures originally shipped in this pass were pulled back out: the Basis transcoder calls eval() internally, which the strict CSP blocks by design, and the KTX2 path was heavier over the wire regardless. Responsive JPEGs replaced it.
The same globe serves a seismology student tracing a slab, a journalist pulling a shareable link mid-story, and someone who just felt the ground move and wants to know what it was. No install, no account, no query syntax.
Legibility before interpretation. Magnitude and depth are encoded in colour and form, so the read happens before the reasoning.
Time as a first-class axis. The scrubber converts isolated points into the sequence that actually explains them.
Shareability as a feature. Full app state in the URL hash makes every view a link — the cheapest distribution a tool can have.
Performance is a design constraint. Depth view and live shockwaves are only usable because the render budget was engineered to afford them.
Data: USGS Earthquake Hazards Program · Plate boundaries: Peter Bird PB2002 (ODC-By) · Textures: NASA Blue Marble.